Profiling
or: What Did My Application Do in the Afternoon?
This how-to explains how you can profile your Grok application or Grok/Zope itself. This way you get an idea of the bottlenecks of your application or in other words: where it spends its time.
Note
This text is an updated version of my how-to as it can seen on the old Grok site (no, I won’t give a link to that slightly outdated stuff).
Profiling with Grok
When it comes to a web framework like Grok, profiling is not as easy as with commandline or desktop applications. You normally want to trigger certain requests and see, in which parts of your code how much time or memory was spent.
Here is how you can do this.
Prerequisites
We assume you know how to create a Grok project (your application) and have one already at hand.
Installing a profiler
There are some profiling tools available with every Python installation. Usually, they are started together with some desktop- or commandline application, wrapping it in a way to measure internal calls and other things interesting for developers.
With web-frameworks, however, we often only want to check certain requests. Luckily, with Paste and WSGI we have a mechanism, that can serve in a similar way: we can define a (WSGI) pipeline of apps and filters that wrap each other, similar to the approach of regular non-web applications. We also have a profiler already available, that is some WSGI application itself and can profile things when some HTTP request comes in: repoze.profile is even configurable over a web frontend.
Install repoze.profile
In the buildout.cfg of your project add the repoze.profile egg to list
of eggs of your application. Look out for a section named [app], which
could read like this or similar:
...
[app]
recipe = zc.recipe.egg
eggs = cptapp
       z3c.evalexception>=2.0
       Paste
       PasteScript
       PasteDeploy
       repoze.profile
interpreter = python-console
...
Here the added repoze.profile stanza is important.
Now run:
$ bin/buildout
to fetch the egg from the net if it is not already available and to make it known to the generated scripts.
Create a profiler.ini
To make use of the new egg we must tell paster about it. This is done by an appropriate initialization file we create now:
# file: profiler.ini
[app:myapp]
use = egg:sample

[filter:myprofiler]
use = egg:repoze.profile#profile

[pipeline:main]
pipeline = myprofiler myapp

[server:main]
use = egg:Paste#http
host = 127.0.0.1
port = 8080

[DEFAULT]
# set the name of the zope.conf file
zope_conf = %(here)s/zope.conf
Here we tell paster (the HTTP server) in the pipeline to filter
each web request passing it first to repoze.profile which then calls
our own sample application. This way the profiler can start its
job and measure all calls done by the following application call.
It is crucial, that you use the name of your project egg here in the
[app:myapp] section. In the sample config above we assume that the
project (application) is called sample, so that the egg with our
application is called the same.
Note
modern Grok projects put their paster configuration files as
templates into the local etc/ directory and do not
call them debug.ini, profile.ini, etc. but
debug.ini.in, profile.ini.in, etc (note the trailing
.in). This is not covered here.
Put this new file in the same directory as where your zope.conf
lives (not zope.conf.in). For newer projects this is
parts/etc/.
Start Profiling
With the given setup we can start profiling by:
$ bin/paster serve parts/etc/profiler.ini
If your profiler.ini file resides elsewhere, you must use a
different location, of course.
Note
you dont’t have to create a separate profiler config. You
can, of course, update an existing deploy.ini or
debug.ini. But as profiling takes more time than calls
without profiling, it is a good idea to enable profiling
only on request, i.e. when starting paster with a
respective configuration.
The server will start as usual and you can do everything you like with it.
Browsing the Profiler
To get to the profiler, enter the following URL:
This brings us to the profiler web frontend. If you have browsed your instance before, you will get some values about the timings of last requests. If not, then browse a bit over your application to collect some data. The data is collected ‘in background’ during each request and added to the values already collected.
The result might look like this:
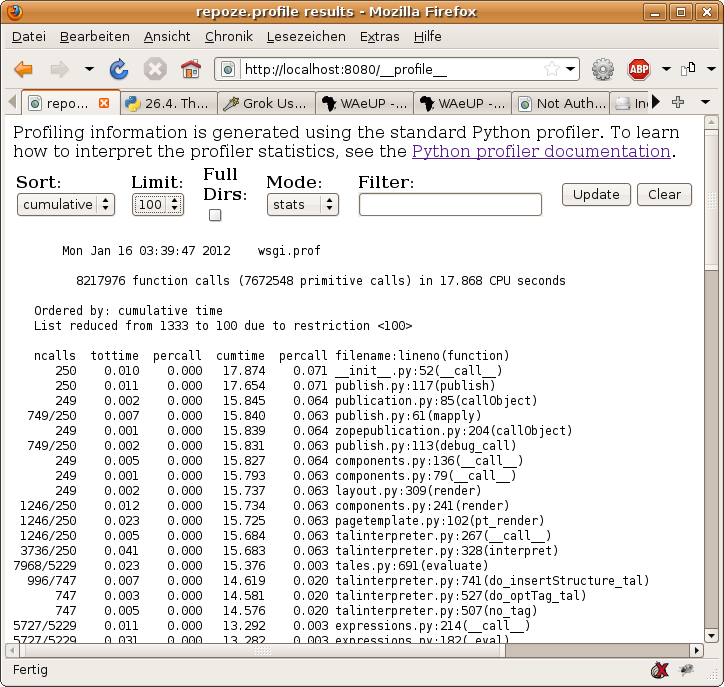
As you can see, there are a few options you can play with. You can filter the results by name, sort it by time or other stats, enable display of full paths, etc.
When you stop paster, all collected data is removed. On the next start you can generate new one.
Profiling a certain view
Say we want to profile the performance of the index view created
by the our application. To do this, we first have to install an
instance of our application. Let’s call it simply app.
So, create an instance of your application under the name app in
the grok UI admin interface.
Now we can access
and the usual index page will (hopefully) appear.
If we go back to the profiler, however, we will see the summed up values of all requests we did up to now - including all the actions in the admin interface etc. we are not interested in.
We therefore clear the current data by clicking on clear on the
profiler page.
Now we access the page we want to examine directly and go to the above URL directly.
When we now go back to the profiler, we only see the values of the last request. That’s the data we are interested in.
Profiling mass requests
Very often a single request to a view does not give us reliable data: too many factors can influence the request to make its values not very representative. What we often want are many requests and the average values appearing here.
This means for our view: we want to do several hundreds requests to the same view. But as we are lazy, we don’t want to press the reload button several hundred or even thousand times. Luckily there are tools available, which can do that for us.
One of this tools is the apache benchmarking tool ab from the
Apache project. On Ubuntu systems it is automatically installed, if
you have the apache webserver installed.
With ab (apache benchmarking) we can trigger 1,000 requests to our
index page with one command:
$ ab -n1000 -c4 http://127.0.0.1/app/@@index
This will give us 1,000 requests, of which at most four are triggered concurrently, to the URL http://127.0.0.1/app/@@index. Please don’t do this on foreign machines!
The result might look like this:
Benchmarking 127.0.0.1 (be patient)
Completed 100 requests
Completed 200 requests
Completed 300 requests
Completed 400 requests
Completed 500 requests
Completed 600 requests
Completed 700 requests
Completed 800 requests
Completed 900 requests
Finished 1000 requests


Server Software:        PasteWSGIServer/0.5
Server Hostname:        127.0.0.1
Server Port:            8080

Document Path:          /app/@@index
Document Length:        198 bytes

Concurrency Level:      4
Time taken for tests:   38.297797 seconds
Complete requests:      1000
Failed requests:        0
Write errors:           0
Total transferred:      448000 bytes
HTML transferred:       198000 bytes
Requests per second:    26.11 [#/sec] (mean)
Time per request:       153.191 [ms] (mean)
Time per request:       38.298 [ms] (mean, across all concurrent requests)
Transfer rate:          11.41 [Kbytes/sec] received

Connection Times (ms)
              min  mean[+/-sd] median   max
Connect:        0    0   0.0      0       0
Processing:    94  152  17.3    151     232
Waiting:       86  151  17.3    150     231
Total:         94  152  17.3    151     232

Percentage of the requests served within a certain time (ms)
  50%    151
  66%    153
  75%    156
  80%    158
  90%    176
  95%    189
  98%    203
  99%    215
 100%    232 (longest request)
Also this benchmarking results can be interesting. But we want to know more about the functions called during this mass request and how much time they spent each. This can be seen, if we now go back to the browser and open
again.
Note
ab, of course, is a simple, rude method for stress
testing. Although it provides many options, you might want
to look for more sophisticated methods to generate tons of
requests. multi-mechanize is such a tool that can kill
your server with the same power as ab but does it
smarter.
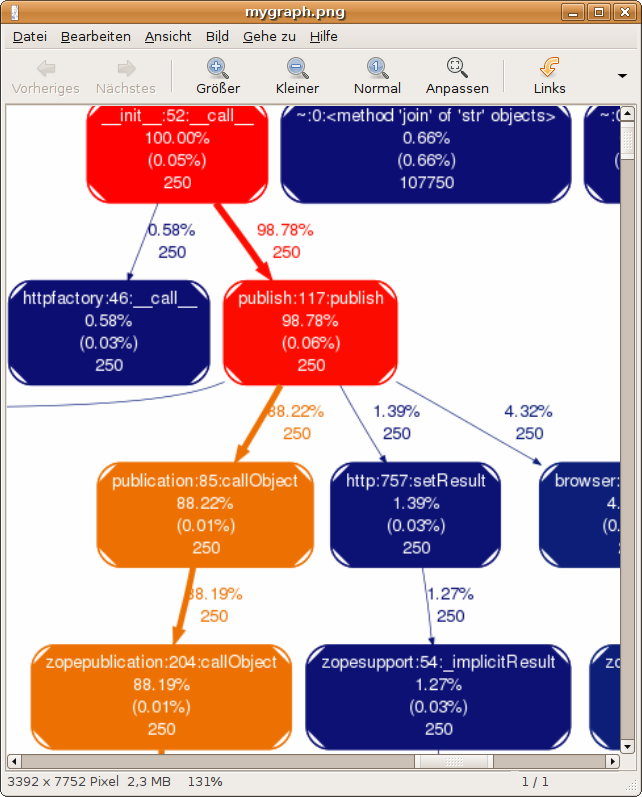
Turning the Data into a Graph
All this is very nice, but sometimes a picture tells more than thousand words. So let’s turn all this data into some graph.
As repoze.profile cannot do this for us, we have to ‘export’ the collected data first.
Exporting Profiling Data
The web frontend provided by repoze.profile is very nice for analyzing ad-hoc. But sometimes we want to have the data ‘exported’ to process it further with other tools or simply archiving the results.
Luckily we can do so by grabbing the file wsgi.prof which contains
all the data presented in the web interface. This file is created by
repoze.profile while working and in the top of the project
directory. In fact the profiler stores all collected data in that
wsgi.prof file also for own usage.
Be careful: when you click clear in the webinterface, then the
file will vanish. Also stopping paster will make it disappear. So
copy it to some secure location where we can process the data further
while the web server is still running (and after you did all requests
you want to analyze).
Because repoze.profile makes use of the standard Python profiler in
the profile or cProfile module, the data in the
wsgi.prof file conforms to output generated by these profilers.
Converting the Data into dot-format
One of the more advanced tools to create graphs from profiling
information is dot from graphviz. To make use of it, we first
have to convert the data in wsgi.prof file into something
dot-compatible.
There is a tool available, which can do the job for us, a Python
script named GProf2Dot which is available at:
Download the script from:
We can now turn our profiling data into a dot graph by doing:
$ python grprof2dot.py -f pstats -o wsgi.prof.dot wsgi.prof
This will turn our input file wsgi.prof of format pstats
(=Python stats) into a dot-file named wsgi.prof.dot.
Converting the dot file into Graphics
Now we can do the last step and turn our dot file into a nice graphics file. For this we need of course the dot programme, which on Ubuntu systems can be easily installed doing:
$ sudo apt-get install dot
Afterwards we do the final transformation by:
$ dot -Tpng -omygraph.png wsgi.prof.dot
This will generate a PNG file where we can see in terms of graphs
where a request (or thousands thereof) spends most of the
time. dot can generate huge graphs. A tiny snippet of a sample
is shown below.
All the used tools (ab, dot, gprof2dot) provide a huge
bunch of options you might want to explore further. This way we can
generate more or less complete graphs (leaving out functions of little
impact), coulours etc.
In the end you hopefully know more about your application and where it spent its time.